TU Darmstadt » MB » Deparment DiK » Education »
Simulation of production systems and processes using Tecnomatix Plant Simulation 11
Chart
![]() Charts display multiple values, data sets, recorded during simulation.
Charts display multiple values, data sets, recorded during simulation.
Enhance your simulation model
Task:
Visualise all states of each sinple processing and assembly station. Ignore all other elements like sources, drains or workplaces.
Step-by-Step:
- Place a chart on your frame.
- Right-click and select the menu entry "Statistics Wizard".
- Select as classes "SingleProc" and "Assembly" (see figure 1).
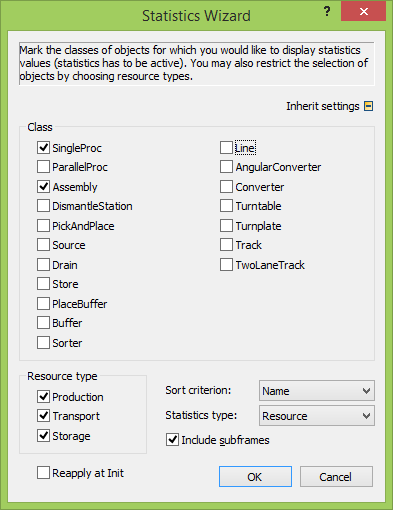
Figure 1: Statistics wizard
- Open the chart and click on the button "Table File". All observed data sets are listed.
- Delete the row "Waiting" by overwriting it with the subsequent rows.
- Run your simulation for a while (in a fast mode). Pause the simulation.
- Right-click on the chart symbol and select the menu entry "Show" (see figure 2). A detailed overview for all select stations and their states is shown.
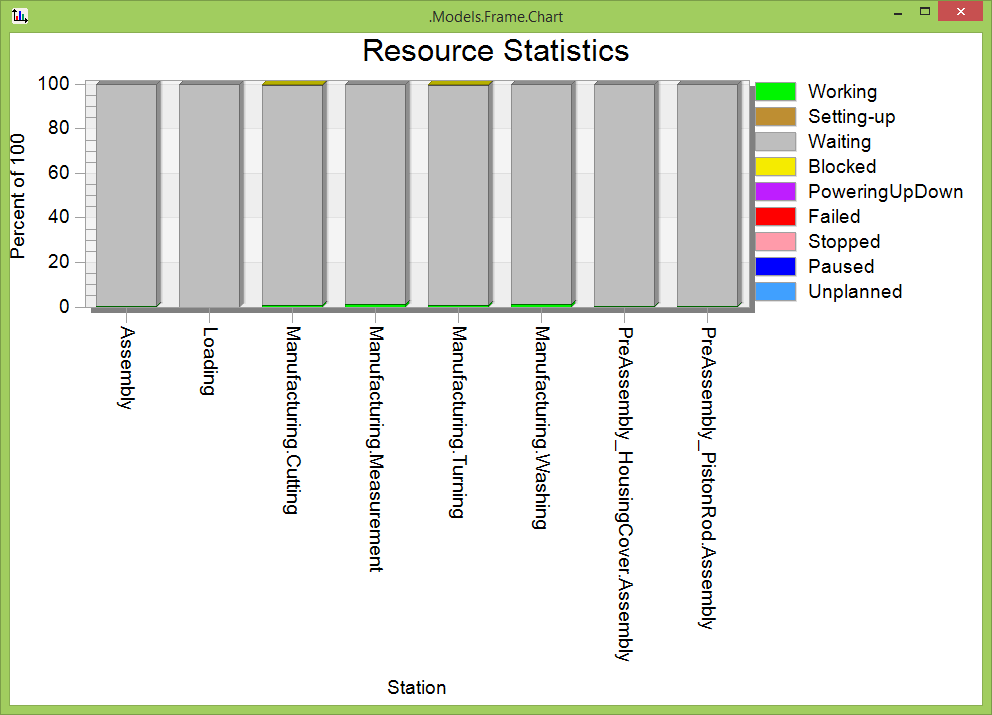
Figure 2: Statistics results