TU Darmstadt » MB » Deparment DiK » Education »
Simulation of production systems and processes using Tecnomatix Plant Simulation 11
Sankey diagram
The ![]() Sankey diagram visualises the flow of material units and workers.
Sankey diagram visualises the flow of material units and workers.
Enhance your simulation model
Task:
Visualise the movment of your workers in the manufacturing frame.
Step-by-Step:
- Drag and drop a "SankeyDiagram" from the class library to your main frame.
- Right-click on the object and select the menu entry "Open Table of Watched MUs".
- Input the path names or drag and drop the follwing class elements to the rows of the table (see figure 1):
- .Resources.Worker
- .Resources.Manufacturer
- .Resources.Assembler
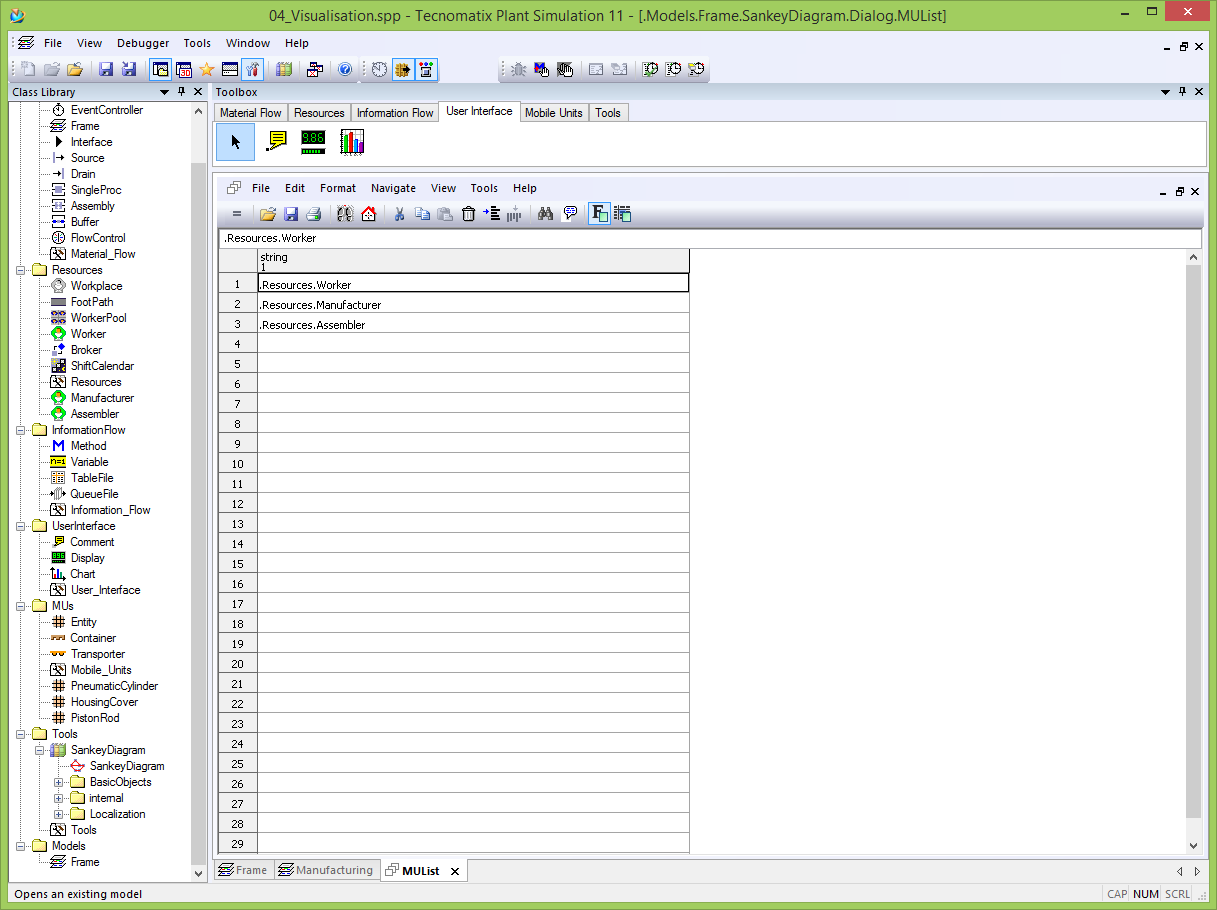
Figure 1: Watched MUs
- Run the simulation for a while. Pause it.
- Right-click on the "SankeyDiagram" and select the menu entry "Display Sankey Diagram".
- Open the frame "Manufacturing" to investigte the results (see figure 2).
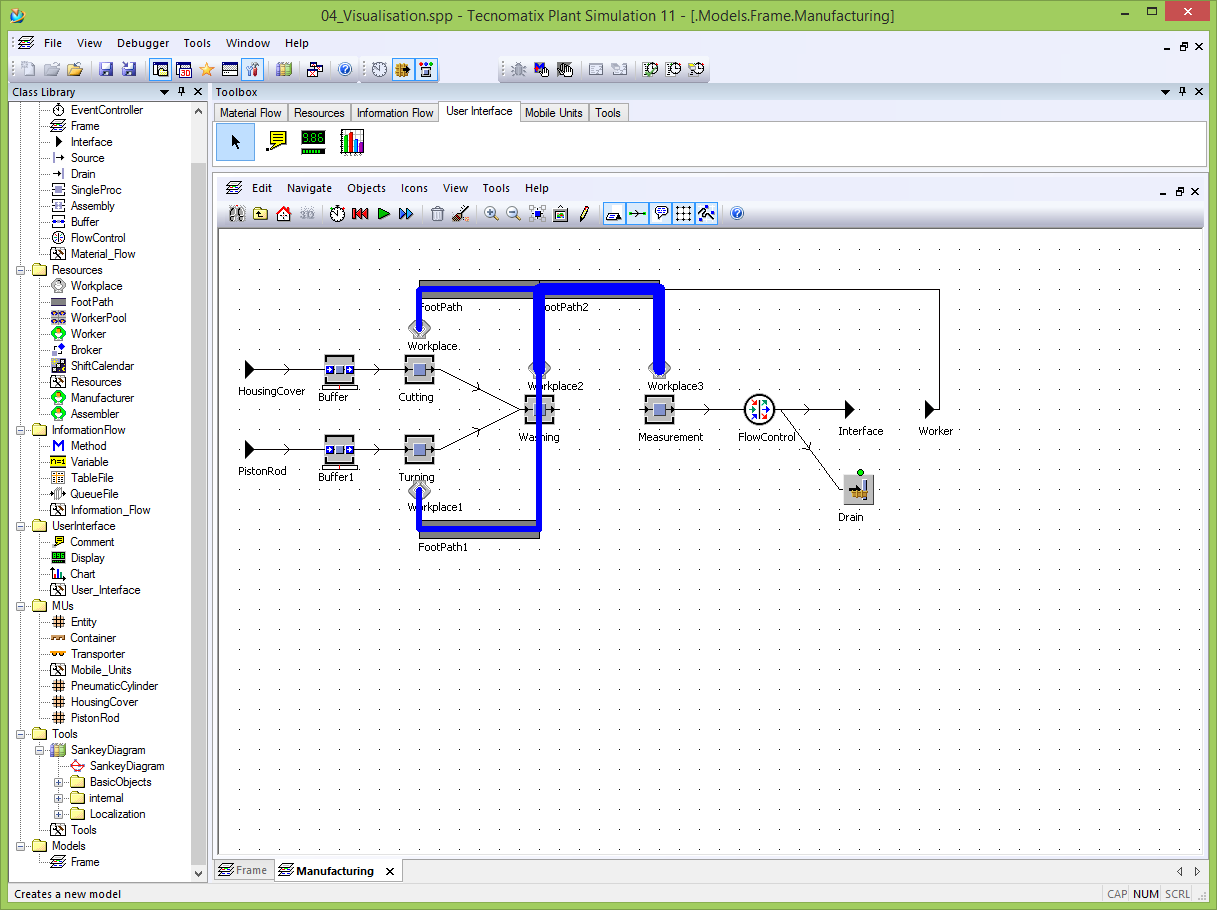
Figure 2: Results of the Sankey diagram
- To remove existing Sankey diagram visulisations, right-click on the "SankeyDiagram" and select the menu entry "Delete Sankey Diagram".