TU Darmstadt » MB » Deparment DiK » Education »
Simulation of production systems and processes using Tecnomatix Plant Simulation 11
Table file and queue file
The ![]() table file is a table with two or more columns and any number of rows. Each cell is accessed using their index, for example the number of the column and the numner of the row starting with "1".
table file is a table with two or more columns and any number of rows. Each cell is accessed using their index, for example the number of the column and the numner of the row starting with "1".
The ![]() queue file is a list with only one column. All data is accessed using the FIFO policy (First In First Out).
queue file is a list with only one column. All data is accessed using the FIFO policy (First In First Out).
Enhance your simulation model
Task:
The "housing" good is delivered at the following simulation time:
- after 0 seconds:
- Delivery Time: 0
- MU: .MUs.Entity
- Number: 1
- Name: (default)
- Attribute: (default)
- after 6 hours and 10 minutes:
- Delivery Time: 22200
- MU: .MUs.Entity
- Number: 2
- Name: (default)
- Attribute: (default)
- after 7 hours:
- Delivery Time: 7:00:00
- MU: .MUs.Entity
- Number: 1
- Name: (default)
- Attribute: (default)
50% of delivered housing covers are defect and have to be put to waste after the measurement:
- defect:
- MU: .MUs.HousingCover
- Portion: 0,50
- Number: 1
- Name: (default)
- Attributes: defect, Name of Attribute: defect, boolean: true
- good:
- MU: .MUs.HousingCover
- Portion: 0,50
- Number: 1
- Name: (default)
- Attributes: (default)
Step-by-Step:
- Create a table file "DeliveredHousing" using the button
 in the toolbox. Place it near the source "Housing".
 - Open the source and select as time of creation "Delivery Table" (1) (see figure 1).
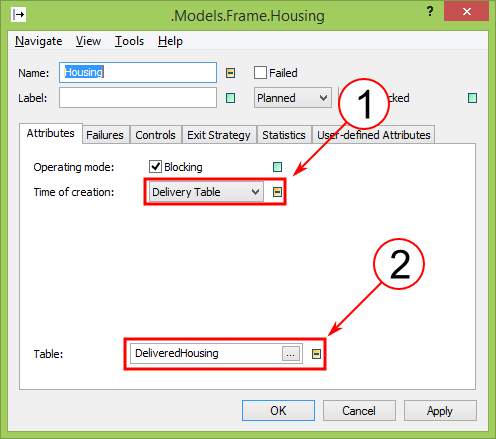
Figure 1: Delivery Table
- Drag and drop the table on the field "Table" or input "DeliveredHousing" (2).
- Open the table "DeliveredHousing". Input the rows appropriate to the list above.
- Create a table file "DefectHousingCover" using the button in the toolbox. Place it near the source "HousingCover".
- Open the source and select as MU selection "Percentage" (1) (see figure 2).
- Drag and drop the table on the field "Table" or input "DefectHousingCover" (2).
- Open the table "DefectHousingCover". Input the rows appropriate to the list above.
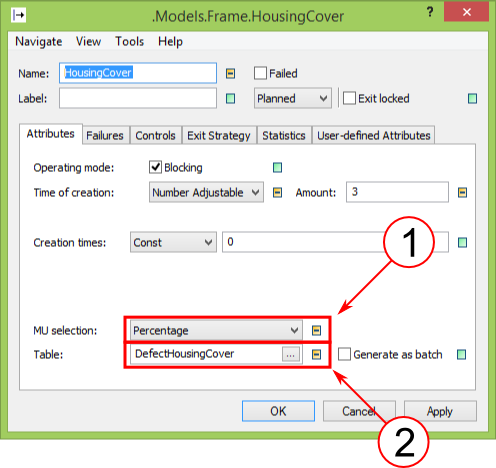
Figure 2: MU selection Percentage - Open the frame "Manufacturing" and insert a flow control and a drain after the station "Measurement" (see figure 3).
- Connect the objects.
- Open the flow control, select Attribute type "Boolean" (1), open the list (2) and input as seen in figure 3.
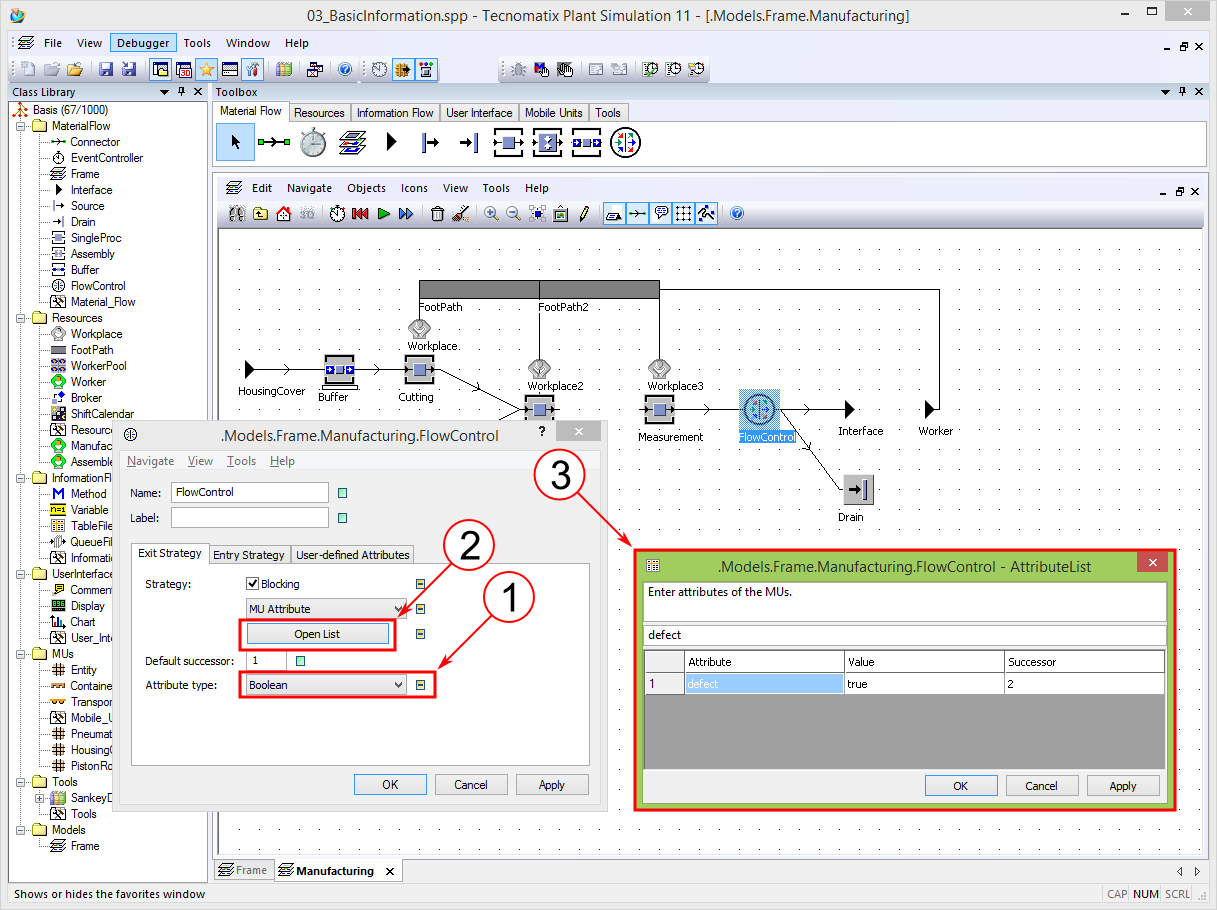
Figure 3: Flow control for defective goods
- Open the drain and input as processing time "1:00:00".
- Start your simulation and watch in the "Manufacturing" frame for defect goods. Therefor regulary stop when new material units enter the housing cover buffer.
- Check if defect goods are sorted out to the "waste" drain.